Modeling Methane Flux for Long-Term Organic Carbon Sequestration
Sanskriti Shindadkar
Mentored by Madison Dunitz
I. Abstract
One promising method for scalable carbon sequestration is industrial algal biomass farming in seawater. Evaporation of the sea water media increases the overall salt content for long term storage, reducing degradation and methane production. However, measuring the long-term emissions is a difficult task to do purely experimentally. Building on PFLOTRAN (a massively parallelized reactive-transport program) we model the relevant microbial reactions and molecular transport, to predict the flux of carbon dioxide and methane from the sequestered biomass. By modelling reactions such as acetaclastic methanogenesis, methylotrophic methanogenesis, and hydrogenotrophic methanogenesis, along with fermentation and acetogenesis, the model is able to forecast the net production and concentration of different chemical species on a 100-year timescale, to ultimately predict methane and carbon dioxide flux, beyond what we can experimentally test in a lab. The forecasted gas production from the model will be compared with future experimental data collected on samples on the order of weeks, months, and perhaps years.
II. Introduction
Carbon sequestration is an essential step we need to take, and scale, in order to reduce humanity's carbon footprint. Reducing emissions is insufficient to counter the rising levels of greenhouse gases in our atmosphere. We emit around 40 billion tons of carbon dioxide every year.1 If a decade of emissions were compressed into a mountain with the density of diamonds, it would be the size of Mount Everest. Many carbon sequestration options alternatives are infeasible: reforestation would require over half of our arable land,2 and direct carbon-air capture costs $500-1000 per ton.3 One promising solution is carbon sequestration through growing algae populations, salting them to prevent degradation, and compacting them underground (e.g. through filling in mines).
III. Methods
There are two main essential steps that need to be taken in order for effective modelling of reducing carbon flux for carbon sequestration using biomass. First, collecting relevant experimental data: both ourselves, and from various research papers. Second, building a reaction-transport model and initializing it with our collected data.
I assisted with the data collection; for example, I prepared incubations containing mixtures of biomass, sludge, sea salt, and magnesium chloride across a range of water activities in order to determine water activity as a function of these different variables. I continued collecting water activity data from these samples, working in collaboration with another SURF student. He uses an Integrated Single Quadrupole machine (ISQ) to measure methane and CO2 flux in the incubations we created earlier this summer. This provided gas production data that I used to better constrain my reaction-transport model, with more accurate rate constants and other needed variables.
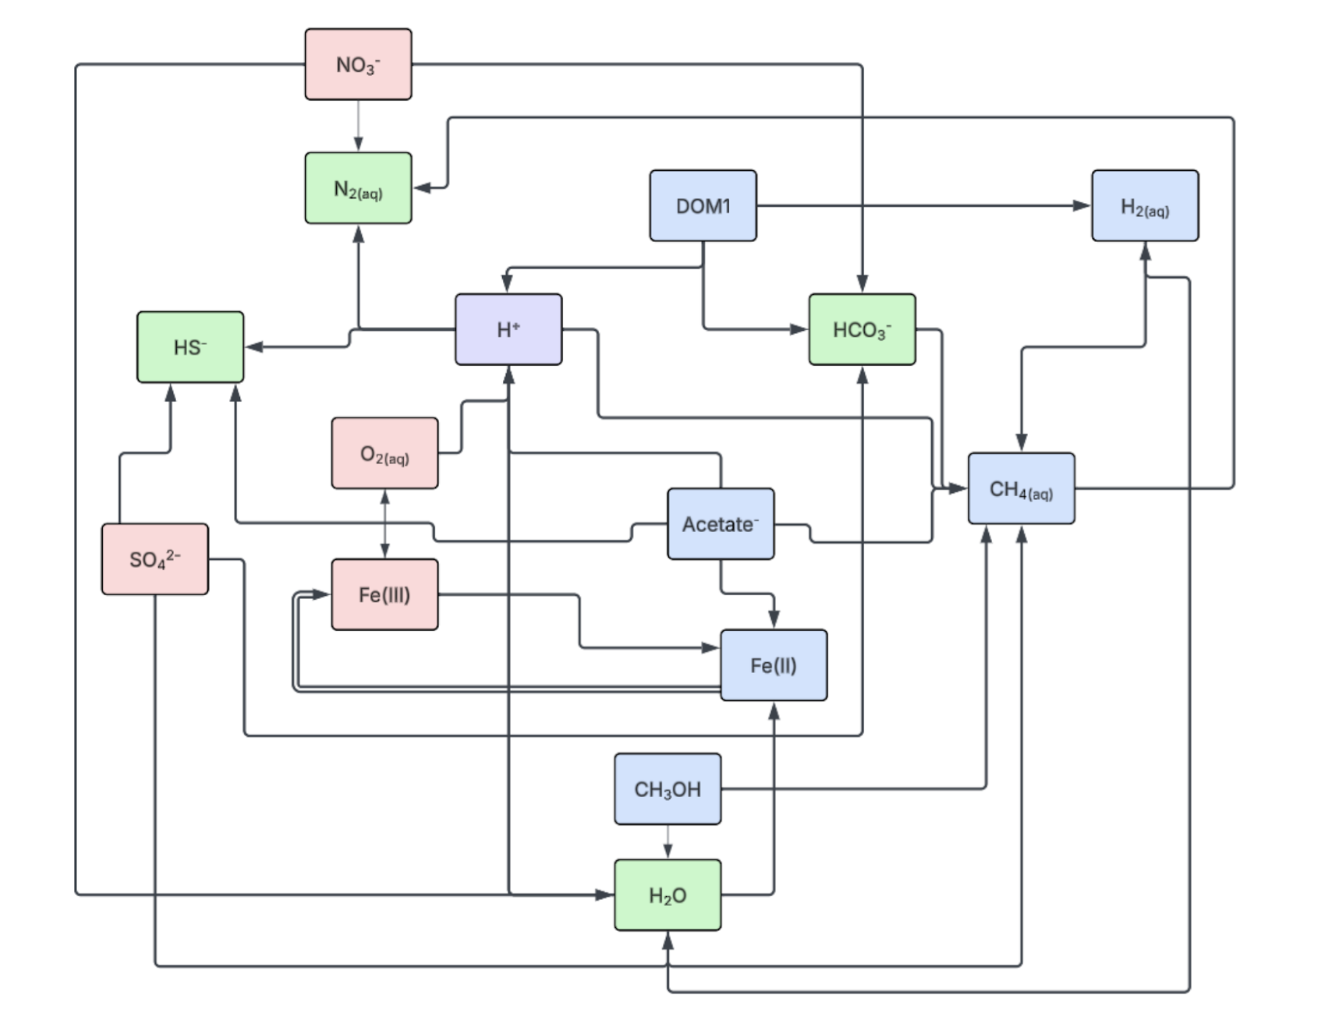
For the model: I've been basing my work off of a working model for a Redox Network for Coastal Saltmarsh Systems, published by O'Meara.4 They use PFLOTRAN, a parallel subsurface flow and reactive transport simulator that runs on fortran. After exploring PFLOTRAN tutorials and demo files, we worked on replicating the paper's findings by running the referenced code. During a meeting with the corresponding author we discussed the model, and were able to answer many questions we had about her methodology in preparing the model, and numerous strategies she used. To offer just one simple example, she created 'tracker' species, and tracked their concentrations in order to carefully track the relative abundance of how different reactions were producing and consuming different substrates.
Some of the changes I've made include:
- Changing the grid layout to a 3D model instead of a 1D model.
- Modifying atmospheric constraints and boundary constraints to position the cube underground.
- Simulating 'rain' events, as well as constant drainage.
- Modifying the soil properties (e.g. porosity, permeability) to more closely model the biomass we'll be sequestering.
- Adding methylotrophic, hydrogenotrophic, and acetoclastic methanogenic pathways.
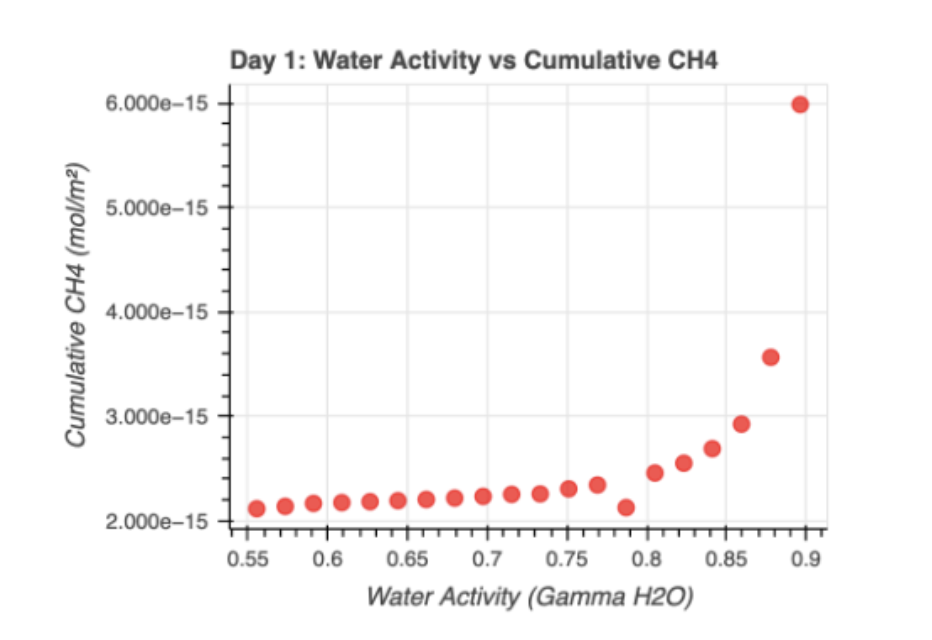
It is important to note that due to differences in the favorability of different metabolic pathways, many processes become unfavorable at different water activities. To define the term, the water activity is a unitless ratio, on a scale of 0 to 1, that indicates the amount of free water available for microbial growth and chemical reactions. Many sources concur that the lowest approximate water activity after which microbial cell division halts is around 0.61 aw.5,6 Many microbial pathways are also influenced by different factors; for instance, consider methanogenesis pathways. There are three main pathways: hydrogenotrophic (reducing CO2 with H2), acetoclastic (breaking acetate into CH4 and CO2), and methylotrophic (reducing methylated compounds like methanol). The acetoclastic pathway can be inhibited by sulfate, as the sulfate reduction pathway creates competition.7
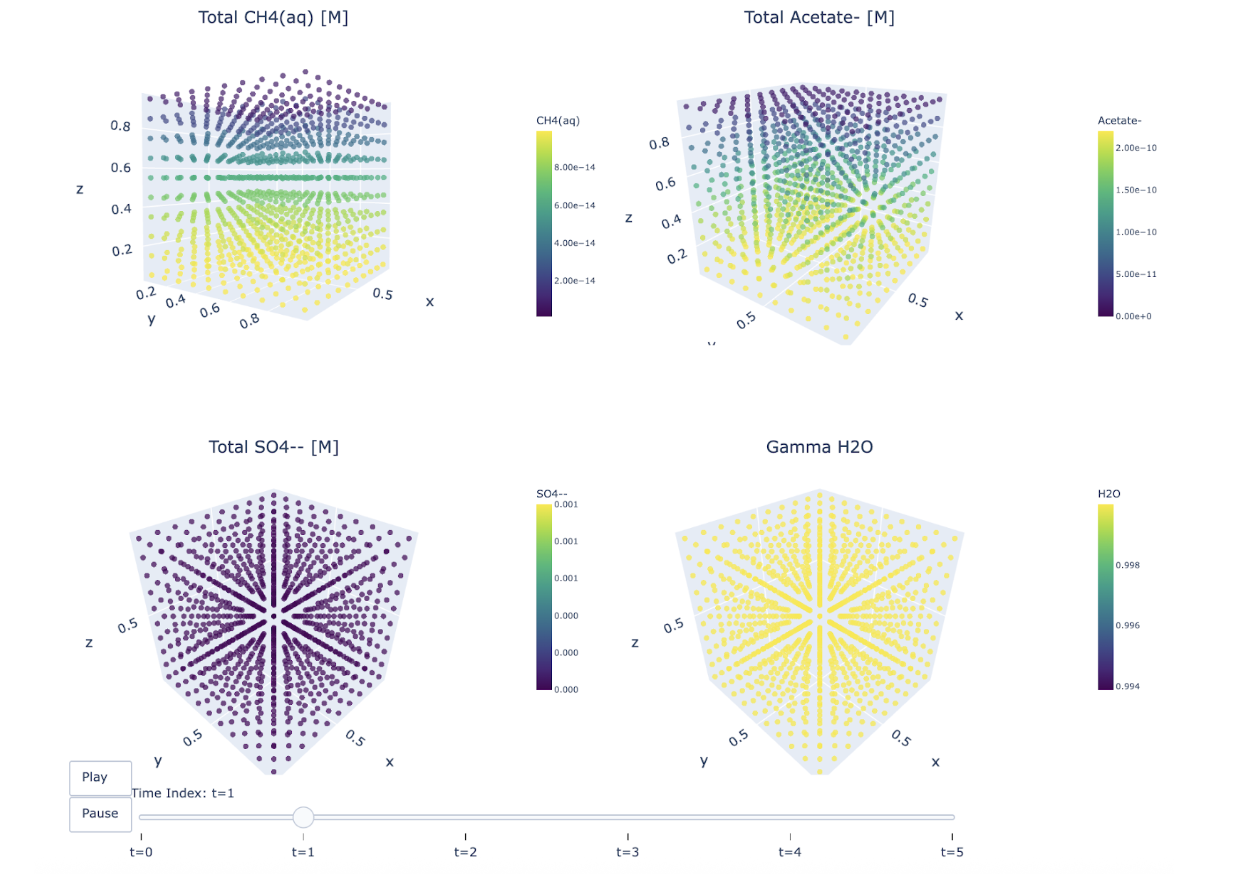
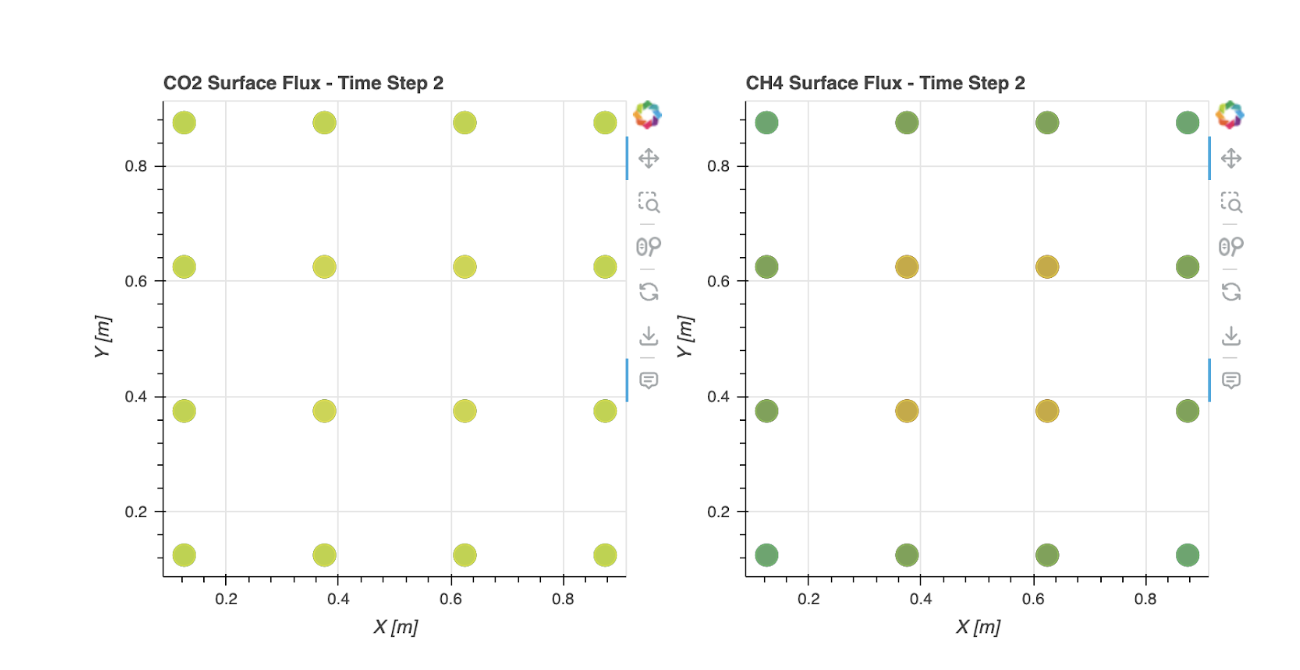
As such, I took advantage of PFLOTRAN's customizability by coding custom reaction sandboxes in order to inhibit the methanogenic pathways at a water activity of 0.5. Templates for adding these custom inhibitions are available in the repository. The code can be found at https://github.com/MDunitz/saltyBiomass/tree/main/software_module for reproducibility. I've also written code for visualization of .tec and .df5 files, which can also be found in the repository. Visualizations that use this code are found in the Results and Discussion section.
IV. Results and Discussion
V. References
- Global Carbon Project. (2024, November 13). Fossil fuel CO₂ emissions increase again in 2024. Global Carbon Budget. https://globalcarbonbudget.org/fossil-fuel-co2-emissions-increase-again-in-2024/
- Perkins, O., Alexander, P., Arneth, A., Brown, C., Millington, J. D. A., & Rounsevell, M. (2023). Toward quantification of the feasible potential of land-based carbon dioxide removal. One Earth (Cambridge, Mass.), 6(12), 1638–1651. https://doi.org/10.1016/j.oneear.2023.11.011
- De Luna, P. (2024, November 29). Will Direct Air Capture Ever Cost Less Than $100 Per Ton of CO₂? Forbes. https://www.forbes.com/sites/phildeluna/2024/11/29/will-direct-air-capture-ever-cost-less-than-100-per-ton-of-co/
- O'Meara, T. A., Yuan, F., Sulman, B. N., Noyce, G. L., Rich, R., Thornton, P. E., & Megonigal, J. P. (2024). Developing a redox network for coastal saltmarsh systems in the PFLOTRAN reaction model. Journal of Geophysical Research: Biogeosciences, 129(3), Article e2023JG007633. https://doi.org/10.1029/2023JG007633
- Stevenson, A., Cray, J., Williams, J. et al. Is there a common water-activity limit for the three domains of life?. ISME J 9, 1333–1351 (2015). https://doi.org/10.1038/ismej.2014.219
- Stevenson, A., Burkhardt, J., Cockell, C. S., Cray, J. A., Dijksterhuis, J., Fox-Powell, M., Kee, T. P., Kminek, G., McGenity, T. J., Timmis, K. N., Timson, D. J., Voytek, M. A., Westall, F., Yakimov, M. M., & Hallsworth, J. E. (2015). Multiplication of microbes below 0.690 water activity: implications for terrestrial and extraterrestrial life. Applied and Environmental Microbiology, 17(2), 257–277. https://doi.org/10.1111/1462-2920.12598
- Sela-Adler, M., Ronen, Z., Herut, B., Antler, G., Vigderovich, H., Eckert, W., & Sivan, O. (2017). Co-existence of Methanogenesis and Sulfate Reduction with Common Substrates in Sulfate-Rich Estuarine Sediments. Frontiers in microbiology, 8, 766. https://doi.org/10.3389/fmicb.2017.00766
VI. Acknowledgements
I would like to extend a thank you to Madison Dunitz for her mentorship, as well as Prof. Victoria Orphan, Dr. Stephanie Connon, and Prof. Alex Sessions, as well as my fellow SURF fellows.
VII. Appendix